Designing for a Better Tomorrow
This university project addressed companies’ challenges in addressing and improving sustainability efforts. The outcome was an MVP of a web application tailored for software companies to evaluate their sustainability performance and make informed, actionable improvements.
Team 2 HCI Students, 1 Computer Science for Digital Media
Role UI Designer and Academic Research
Key Stakeholders University Research Team, CGI Consulting Firm
Problem Statement
Challenges Addressed
Technology companies face complex challenges when tracking and reporting sustainability. Key challenges include limited resources for sustainability assessment, a lack of standardised frameworks, and difficulty balancing business goals with environmental impact.
Business and User Impact
Providing a clear, scalable way to measure and report sustainability aligns with emerging industry standards and supports companies in improving reputation and reducing costs through sustainable practices.
Market Context
With over 80% of consumers considering sustainability important when choosing companies, the lack of accessible tools for measuring sustainability performance represents a significant gap in the market.
Simplifying sustainability metrics can help companies enhance transparency, improve marketability, and contribute to global sustainability goals.
Research
Methodology
• Studied frameworks like the UN SDGs and ESG criteria, focusing on sustainability metrics applicable to technology.
• Reviewed existing tools from companies like Celsia and Envoria to identify gaps.
• Defined primary users, such as, "Emma Schmidt," a CEO of a small software company, to guide user-centred design decisions
Key Findings
Three Sustainability Pillars
Businesses need clear metrics in environmental, social, and economic aspects.
Scoring Needs
Users benefit from simplified scoring, similar to Nutri-Score, for rapid assessment.
Visual Preferences
Preference for modular dashboards with visual score breakdowns.
Based on this, I led the creation of a sustainability framework that simplifies assessment into three pillars—economy, social, and ecology—scored on a scale of A to G. This scoring system was designed to give companies a clear overview of their performance and areas needing improvement.
Ideation
The ideation phase focused on identifying features to help users achieve their goals. We worked closely with our consulting partner at CGI, engaging in brainstorming and card-sorting activities to ensure the features envisioned aligned with industry needs, which informed our final feature set.
Final Feature Set
Questionnaire
Structured question sets are designed to measure performance and identify areas for improvement accurately.
Reporting Tools
Visual Formats: Three distinct visual formats—3-letter score, sustainability tree, and landscape views—simplify complex data into an easily digestible format.
Automated Reports: Generate professional reports aligned with sustainability standards, supporting marketing, public relations, and stakeholder communication.
Dynamic Visuals: Charts and graphs offer a personalised view of each company's sustainability metrics, enabling tracking and analysis over time.
Sustainability Guides
Access to curated resources and actionable best practices that empower companies to achieve and maintain sustainability goals effectively.
Company Database
A comprehensive collection of sustainability-related data, including company practices and performance metrics. This feature enables users to:
• Access and compare sustainability data across multiple companies.
• Gain valuable insights to benchmark and improve sustainability efforts.
User Personas
We found that small to medium-sized software companies were interested in becoming more sustainable but lacked knowledge and resources. Therefore, we developed user personas for this demographic to inform our design decisions.
Design and Prototyping
Sketches
To begin the design process, rough sketches were created to help visualise the potential user interface. These sketches were then refined into wireframes, which were simple, low-fidelity prototypes showing the proposed application's layout and interactions.
Wireframing
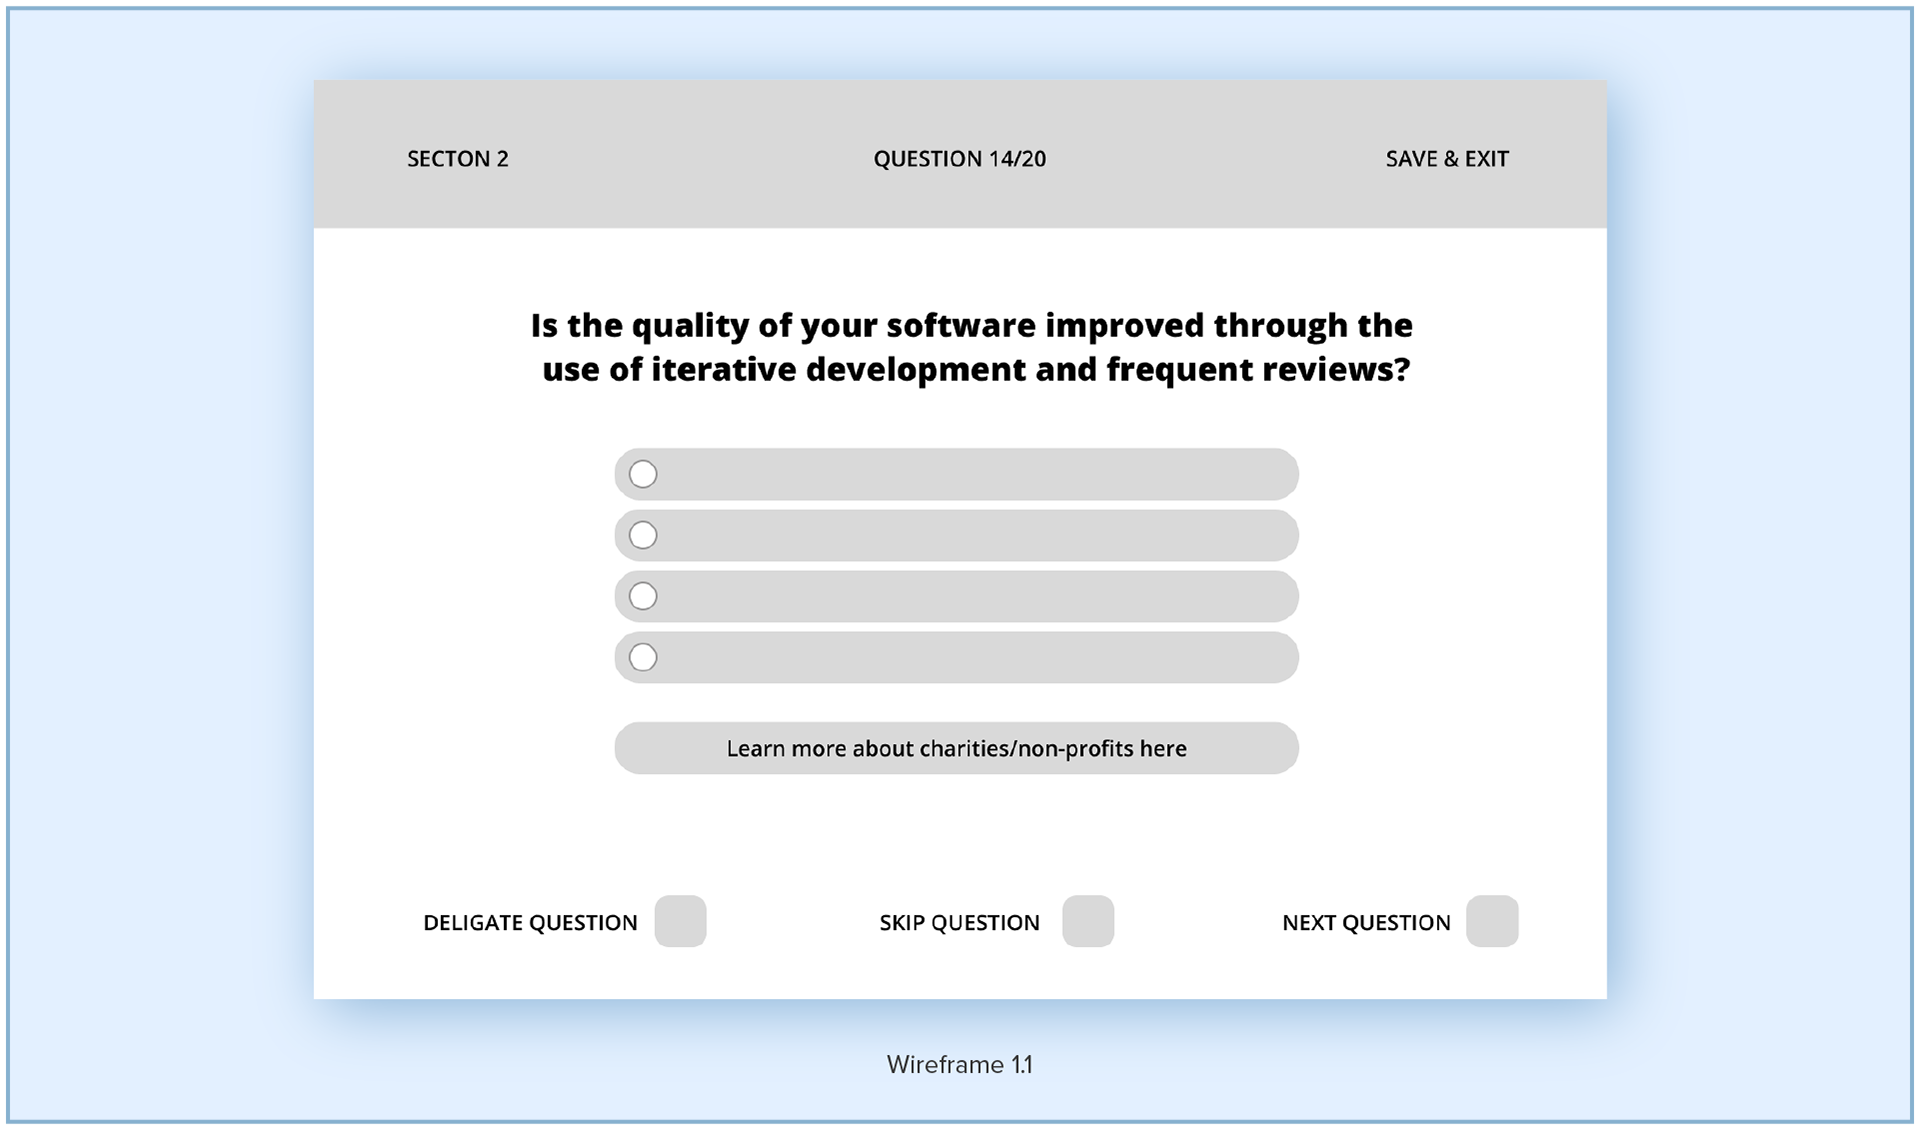
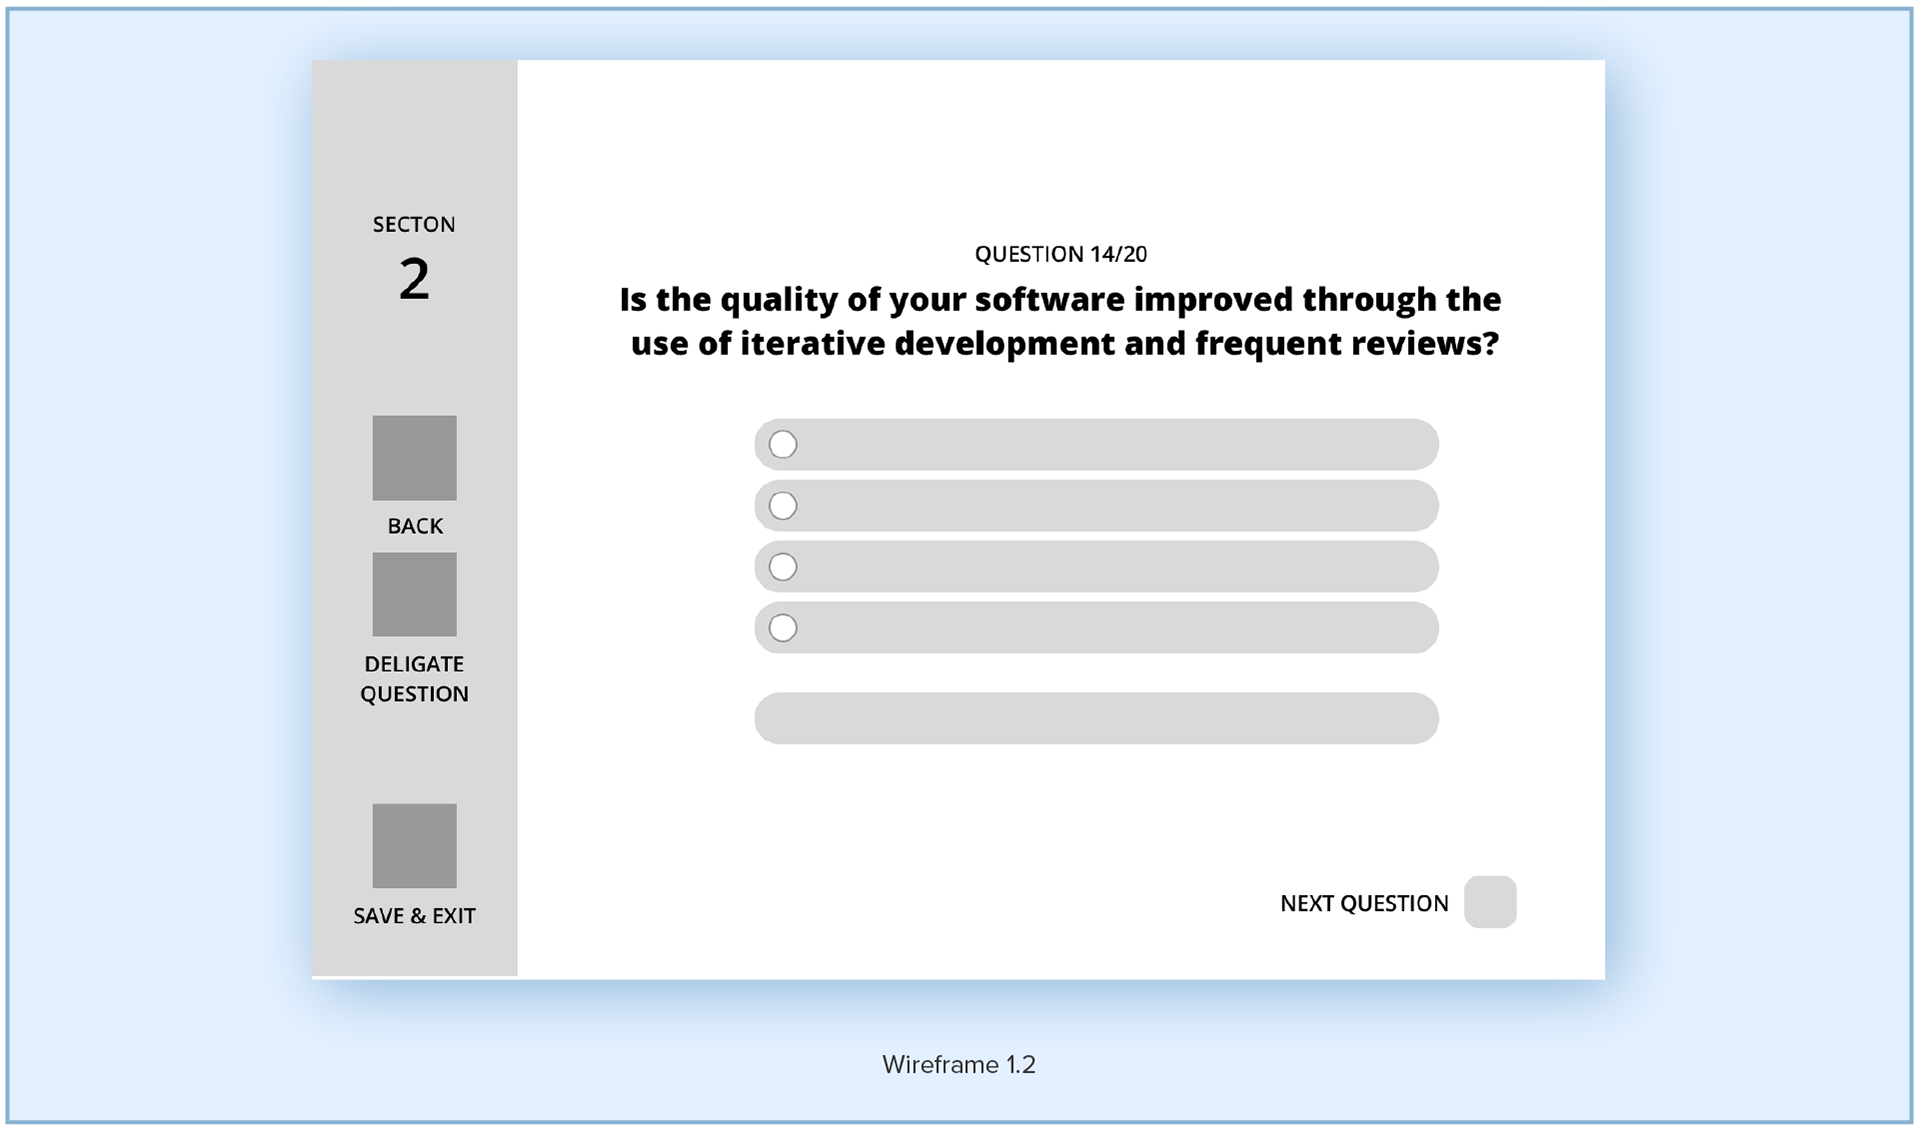
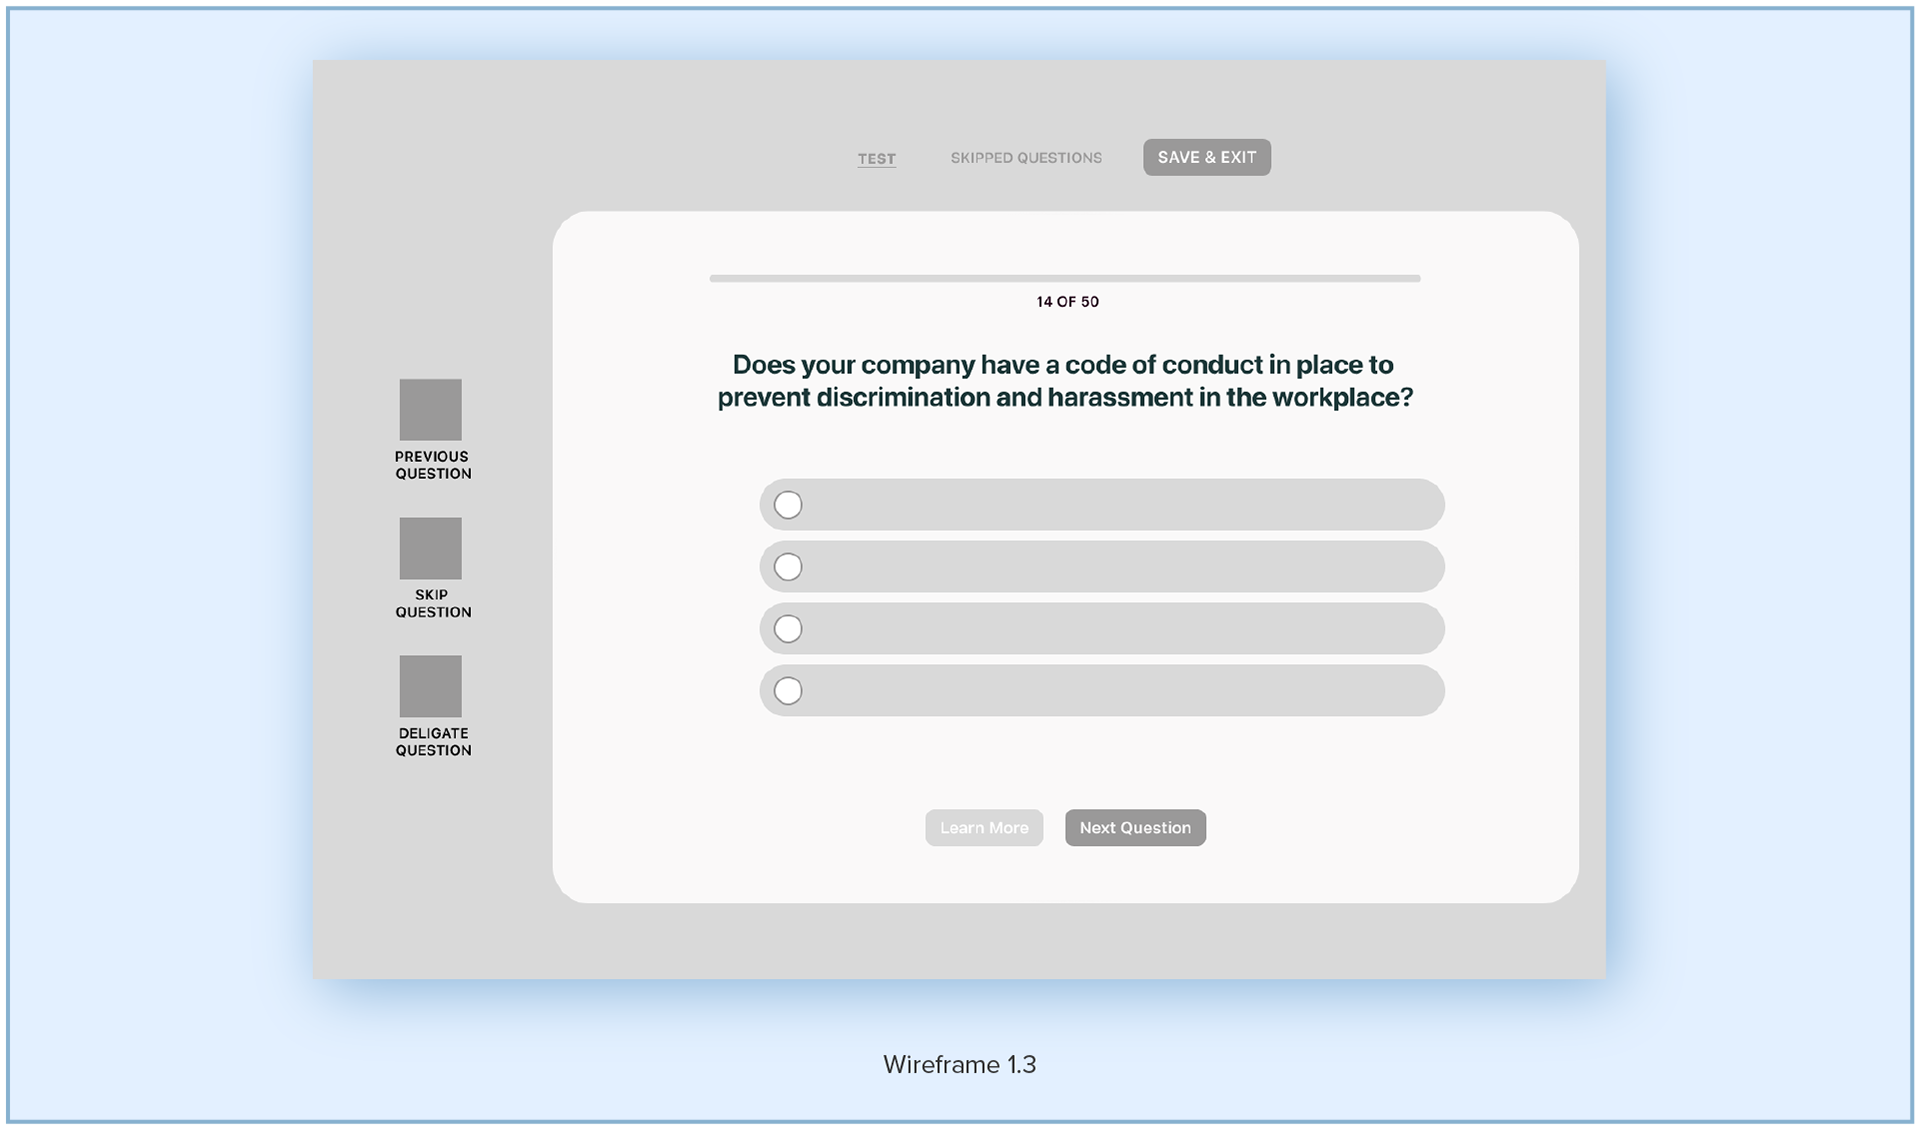
Early wireframes allowed us to use text layout and navigation. Key iterations focused on isolating controls to avoid clutter and making the assessment easy to follow.
Wireframe 1.1
Wireframe 1.2
Wireframe 1.3
In Wireframe 1.3, the questions were isolated from the question controls to create a menu system that was distinct from the controls. This separation allows users to focus solely on the question and provides a clearer visual structure for the assessment.
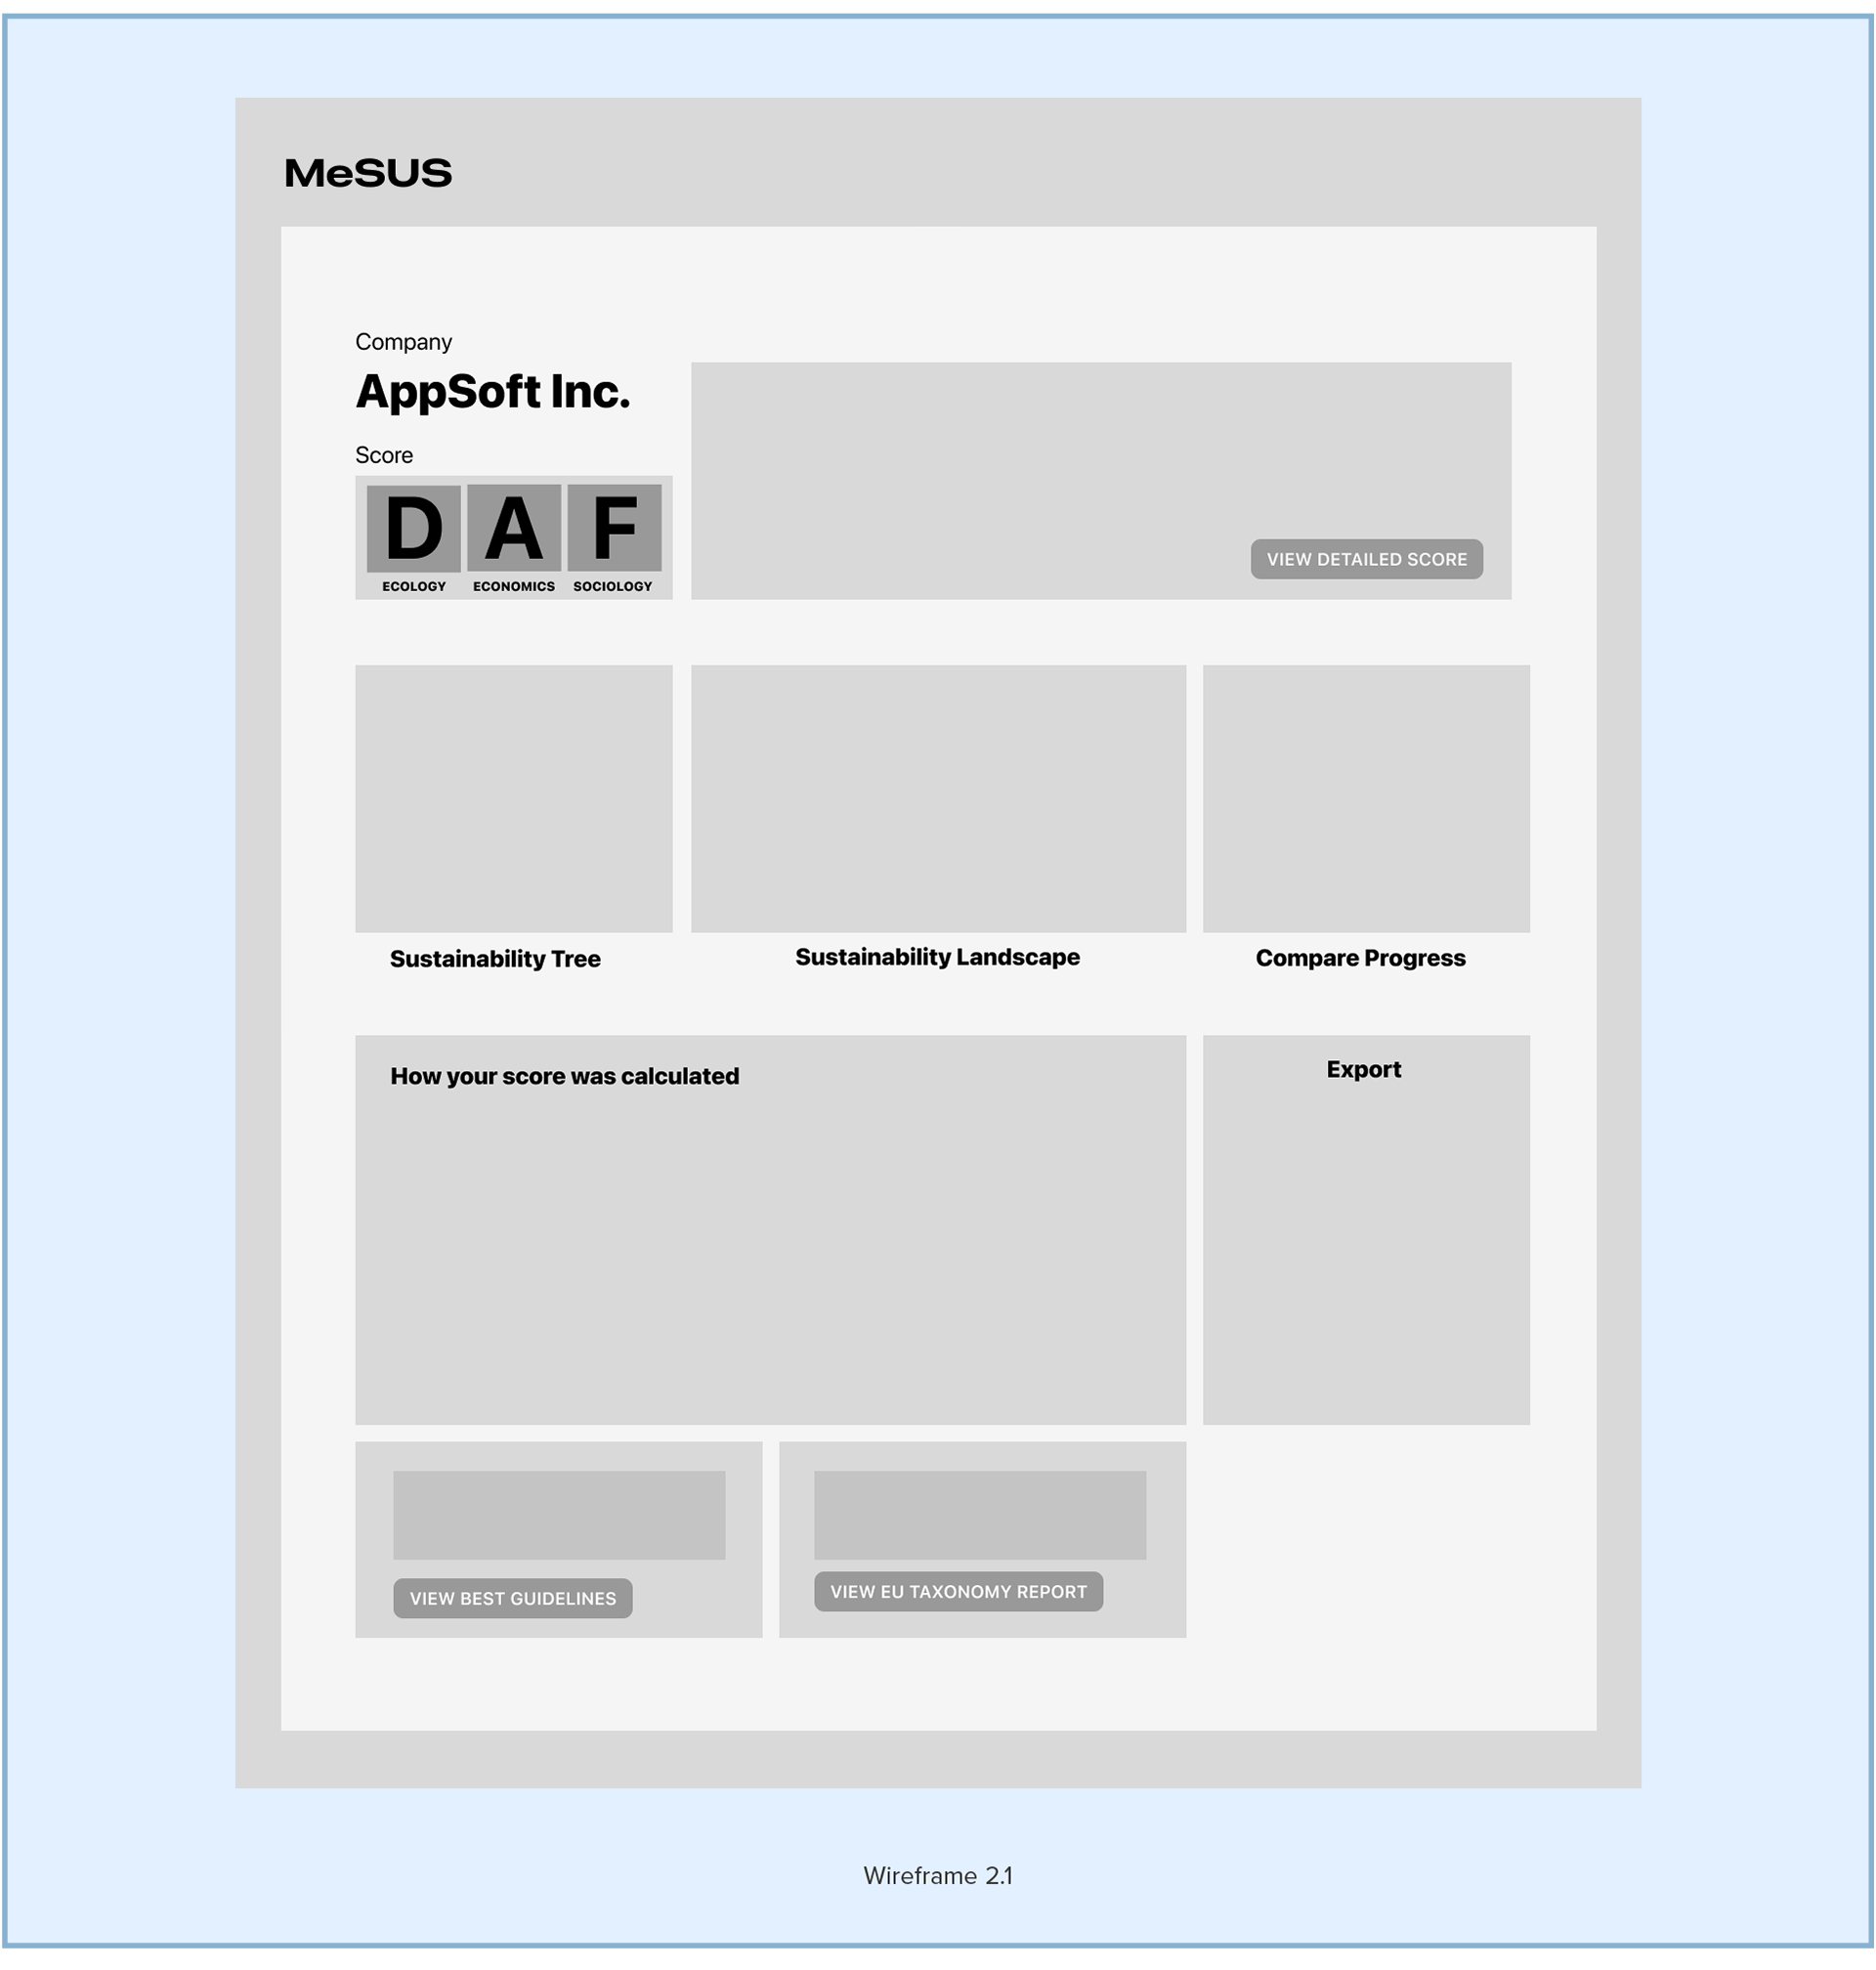
Wireframe 2.1
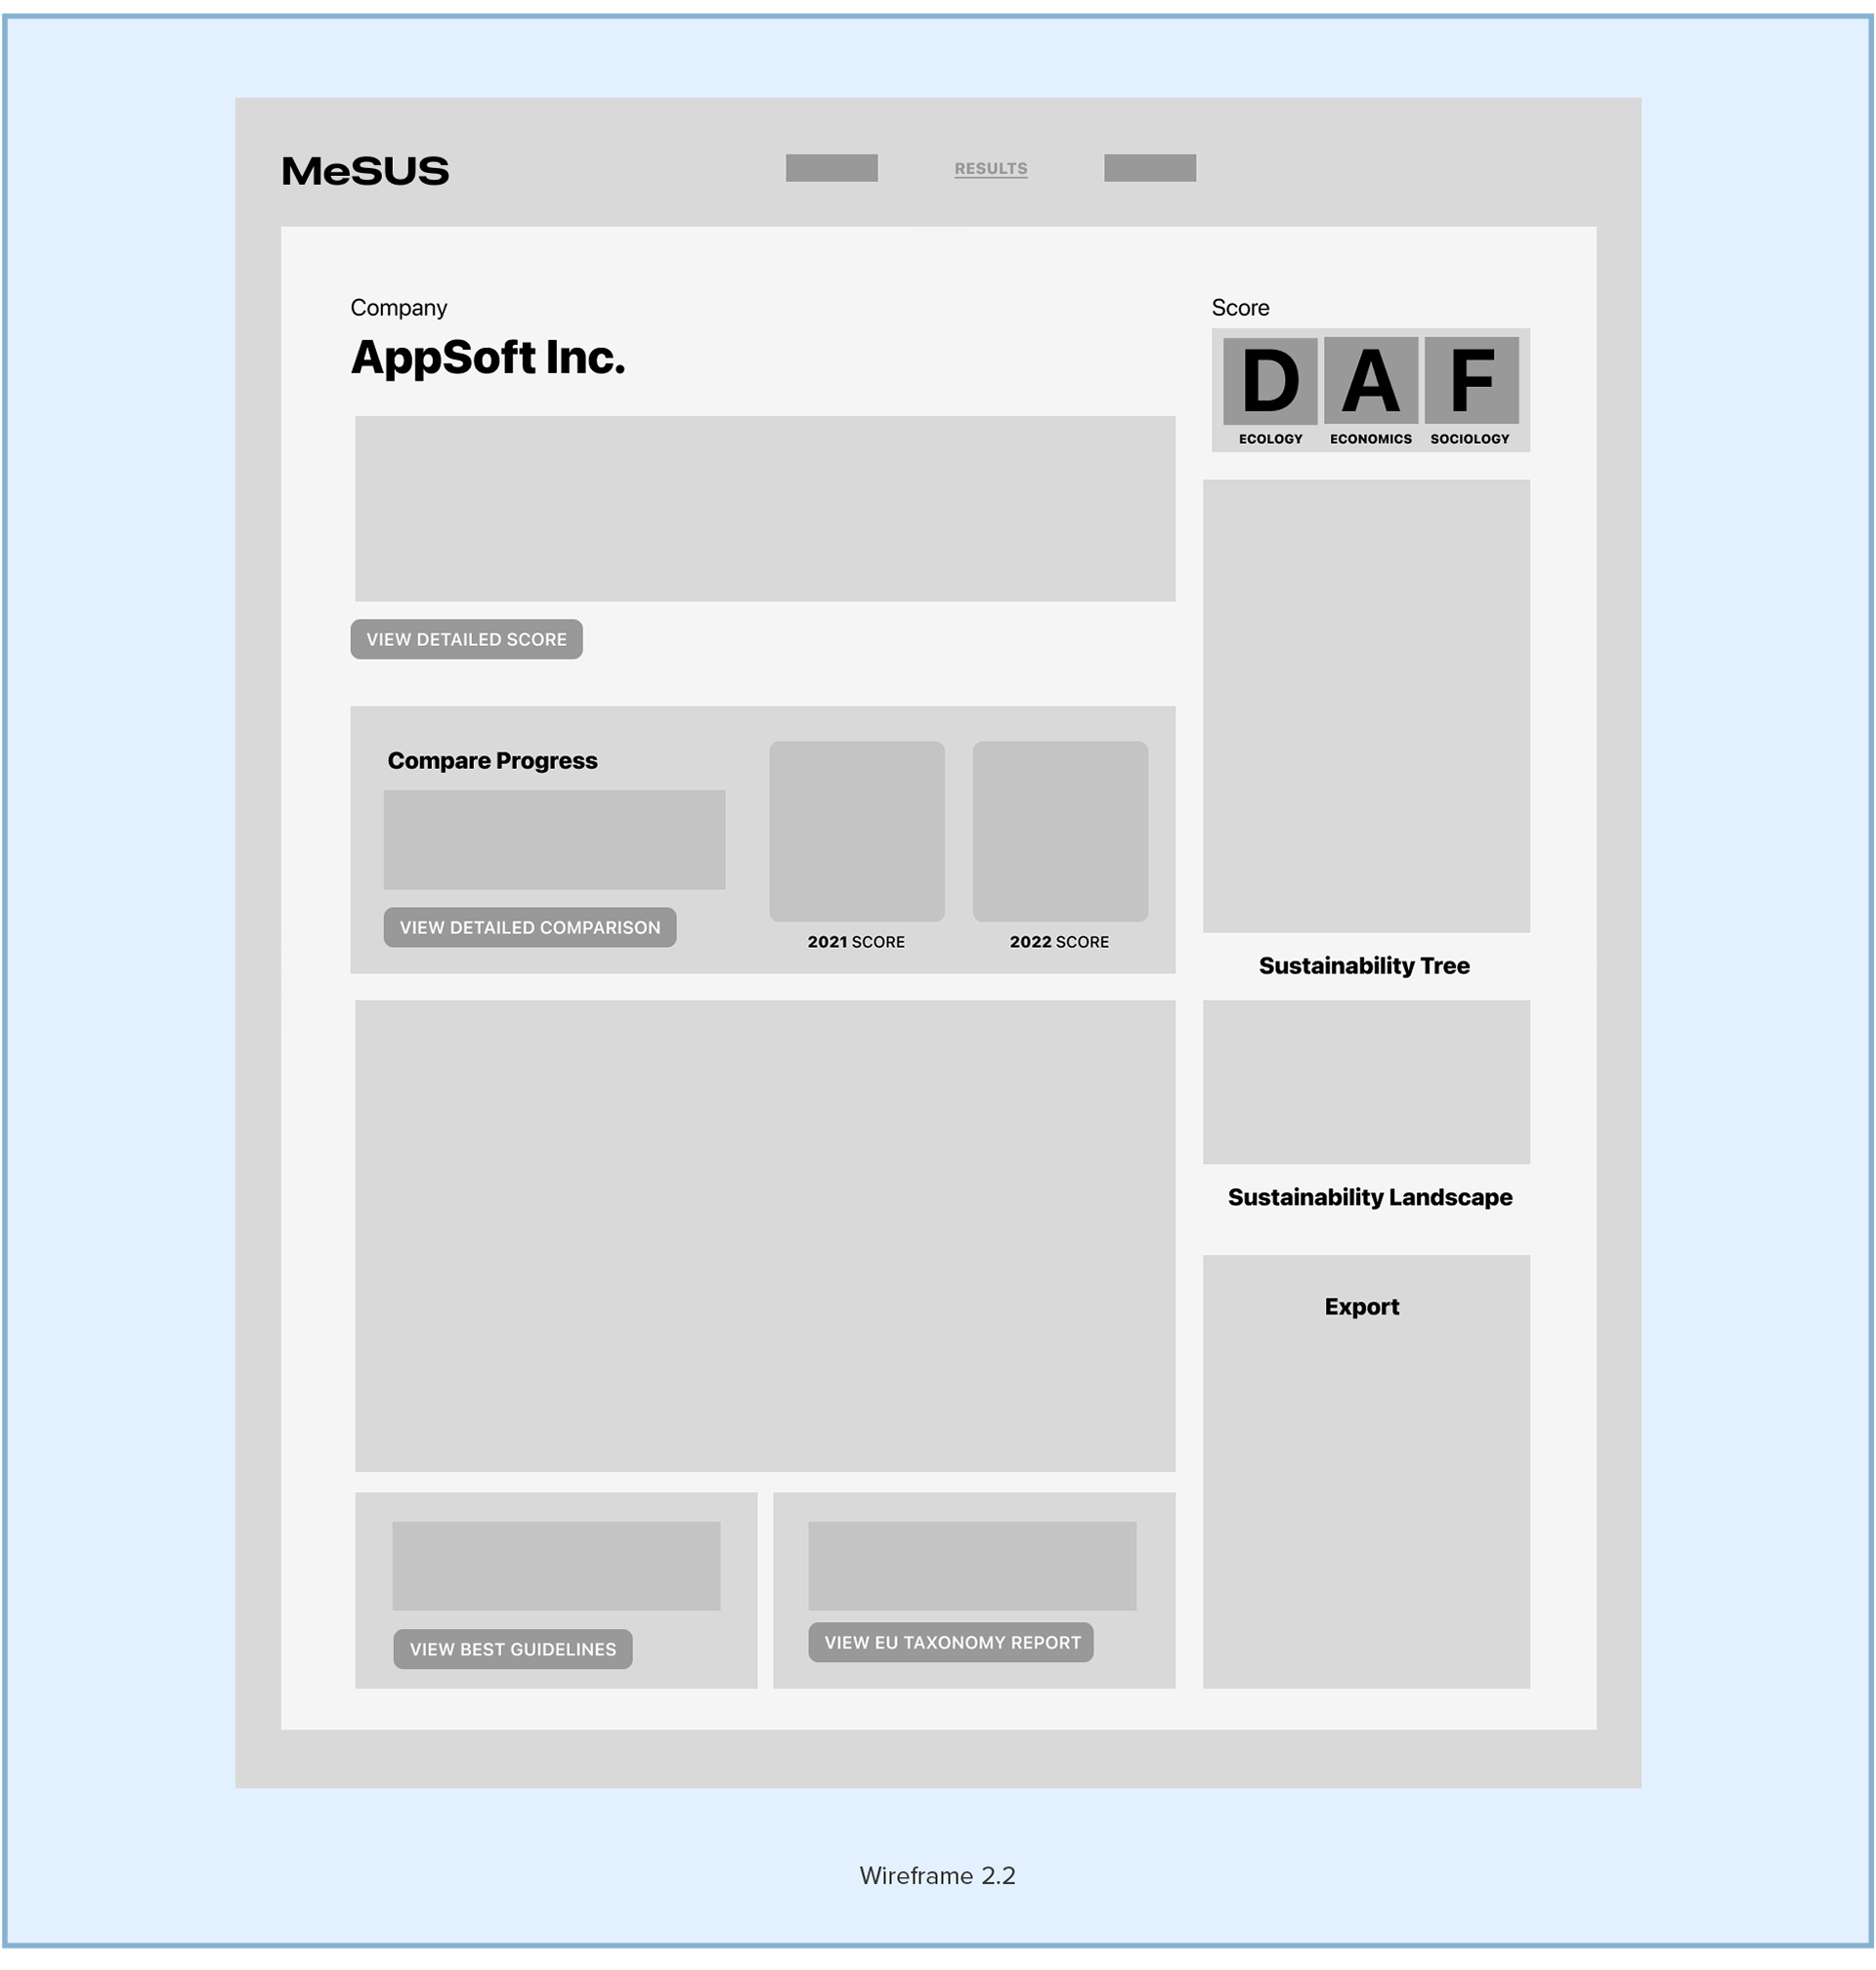
Wireframe 2.2
Progressive Disclosure
The architecture of the results page was changed (Wireframe 2.2), utilising progressive disclosure. This allowed us to show the most important information first while still allowing access to the full set when needed, focusing users on one piece of information at a time.
High-Fidelity Prototypes
The final design featured a modular layout with interactive charts for real-time feedback. The interface was tailored to support users with limited sustainability expertise, ensuring the data was accessible and actionable.
Final Design Highlights
• Summary of environmental, social, and economic scores in a modular layout.
• Colour-coded charts and a letter grade are needed to understand sustainability performance.
• Tracked company performance over time, supporting continuous improvement.
The MVP received positive stakeholder feedback, positioning the tool as a valuable resource for small to medium-sized tech companies aiming to meet sustainability goals.
Further Development
• Usability and Accessibility tests to evaluate ease of use and experience.
• Research into companies' motivations, needs, and behaviours.
• Analysis of data collected from businesses to understand the performance and accuracy of the model.
Reflection
Sustainability is a topic I hold close to my heart, and this project deepened my appreciation for business sustainability and its impact on the environment, society, and economics while strengthening my research and design skills. These insights wil continue to guide me as a designer in future projects, balancing user needs with impactful design solutions that contribute to a sustainable future.
